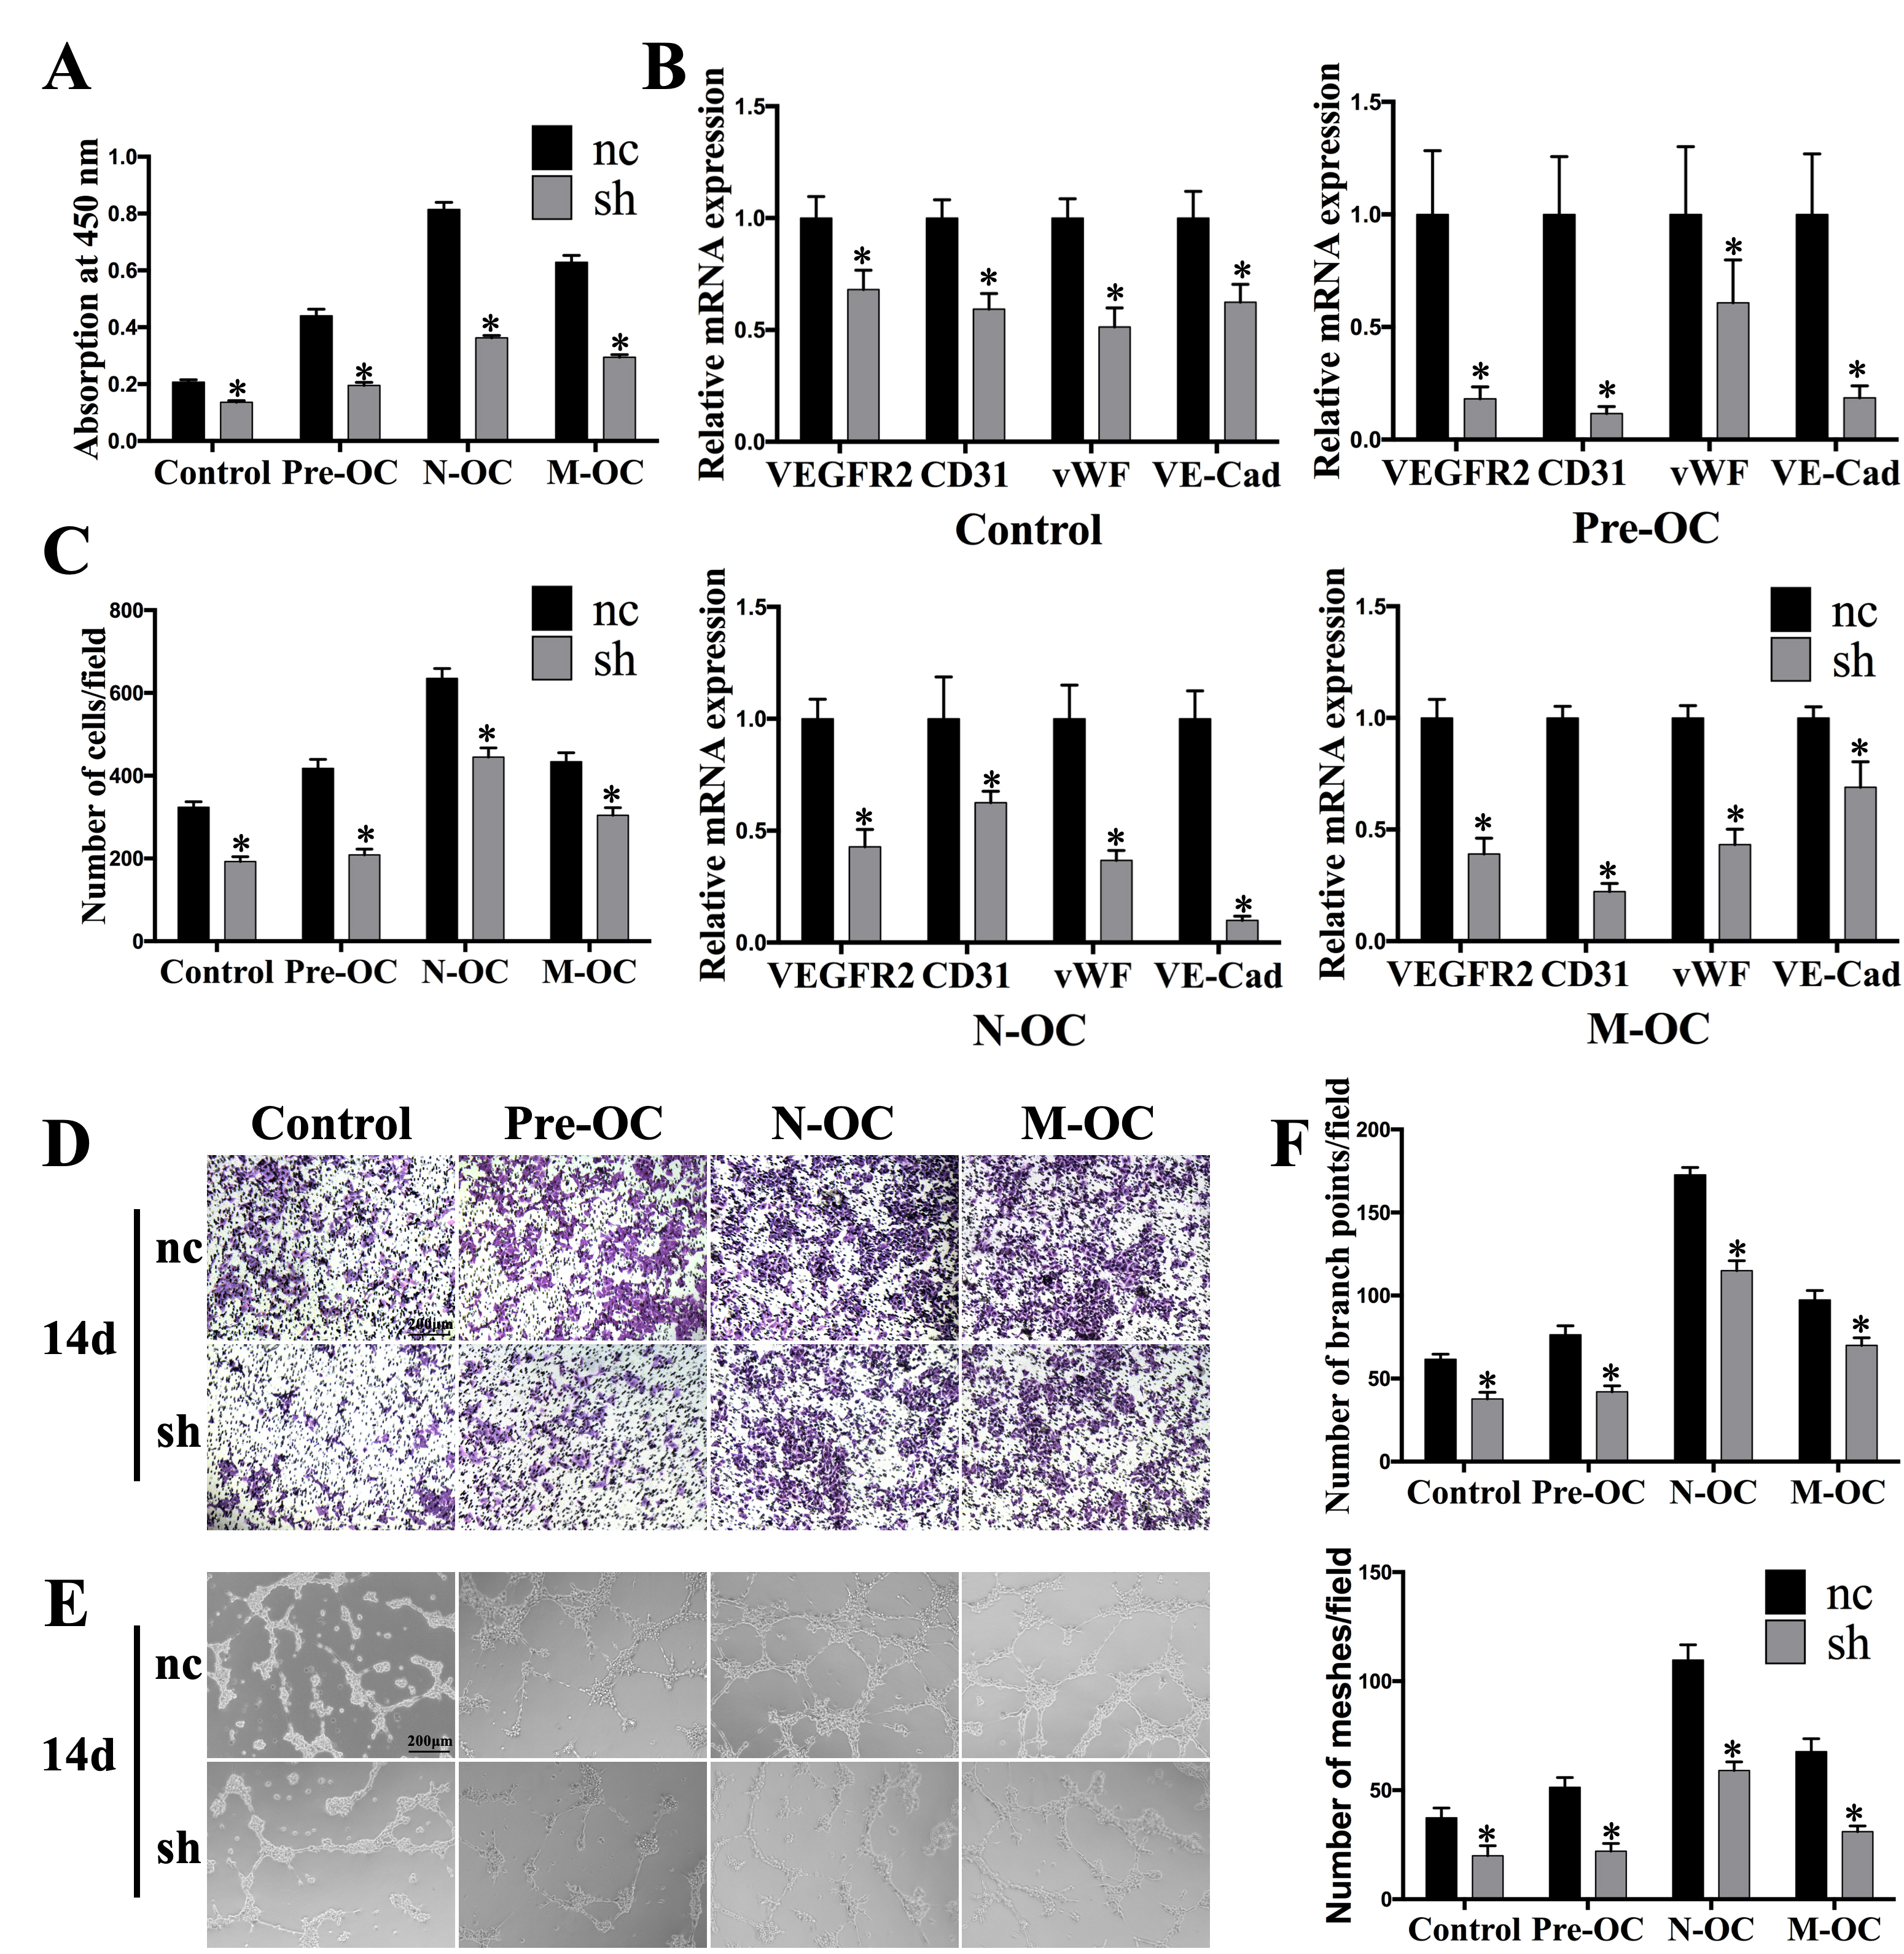
Fig. 3. Inhibition of AK131850 reverses the promoting effect of N-OC and M-OC on EPCs. (A) Absorption at 450 nm of EPCs treated with condition medium from sh and nc of Control, Pre-OC, N-OC and M-OC detected by CCK-8 assay at 14 d. (B) mRNA expression levels of VEGFR2, CD31, vWF and VE-Cadherin in EPCs treated with condition medium from sh and nc of Control, Pre-OC, N-OC and M-OC measured by qRT- PCR at 14 d. (D) Light microscopic images of EPCs treated with condition medium from sh and nc of Control, Pre-OC, N-OC and M-OC at 14 d assessed by migration as¬say. EGM-2MV medium was used as the blank control. Scale bar, 200 μm. (C) Number of migrated EPCs quantified by ImageJ software. (E) Inverted micro¬scope images of EPCs treated with condi¬tion medium from sh and nc of Control, Pre-OC, N-OC and M- OC at 14 d assessed by tube formation assay. EGM-2MV medium was used as the blank control. Scale bar, 200 μm. (F) Number of branch points and meshes quantified by ImageJ software. Data are shown as means ± SD. *P<0.05.